Overview
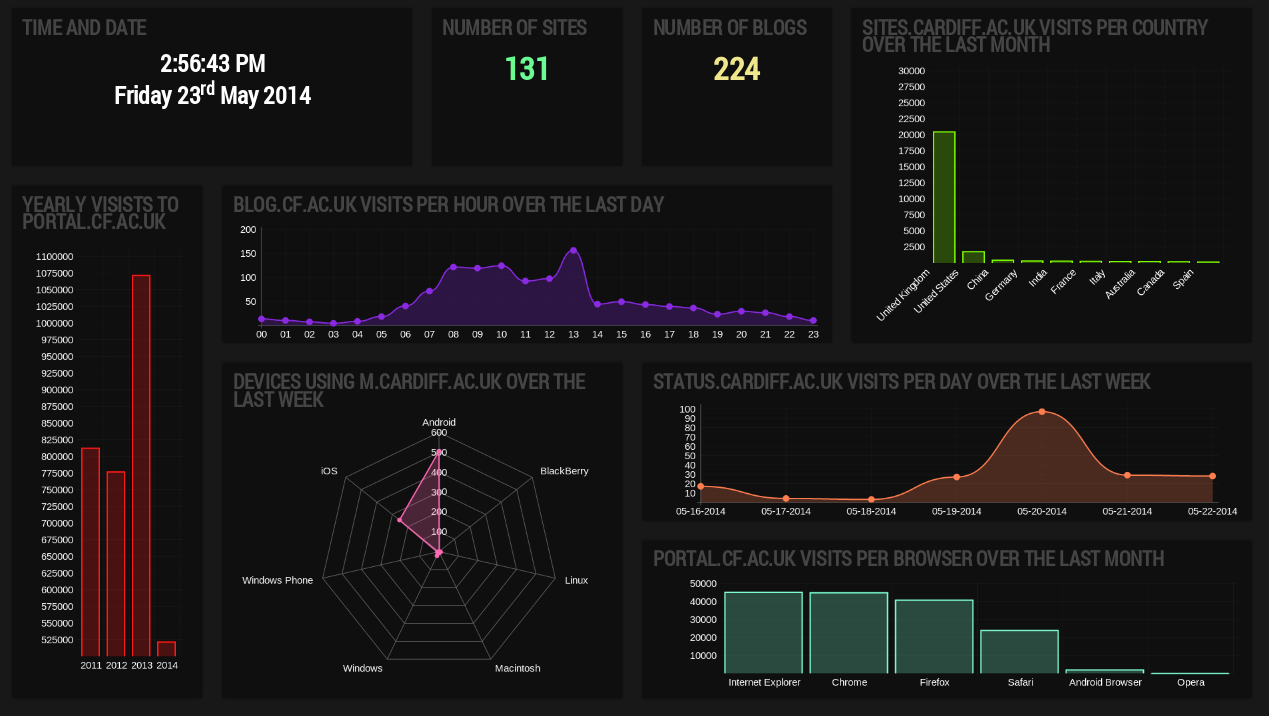
While working at Cardiff University I was asked to create a dashboard for the web development team which would display important site metrics. I created this dashboard using the Atlasboard graph package which runs on a Nodejs server.
A lot of the data I needed to collect was stored on Google Analytics, but the Google Analytics API had not been used with Atlasboard before which meant I had to carry out a lot of research. I posted my solution on Stackoverflow which will hopefully help other users of the dashboard in the future. I also installed a new graph package called Chartjs which includes more graphs and customisation compared to the default graph package that comes with Atlasboard. The developer of Atlasboard saw this solution and asked me to create an official package for Atlasboard which would include the Chartjs and Google Analytics API features.
Screenshot
Technologies
- Atlasboard
- JavaScript
- Chartjs
- Google Analytics api
- Linux Virtual Machine
- Nodejs
- JSON
- Graphite
- CSS
- HTML